Github: Github_Prince
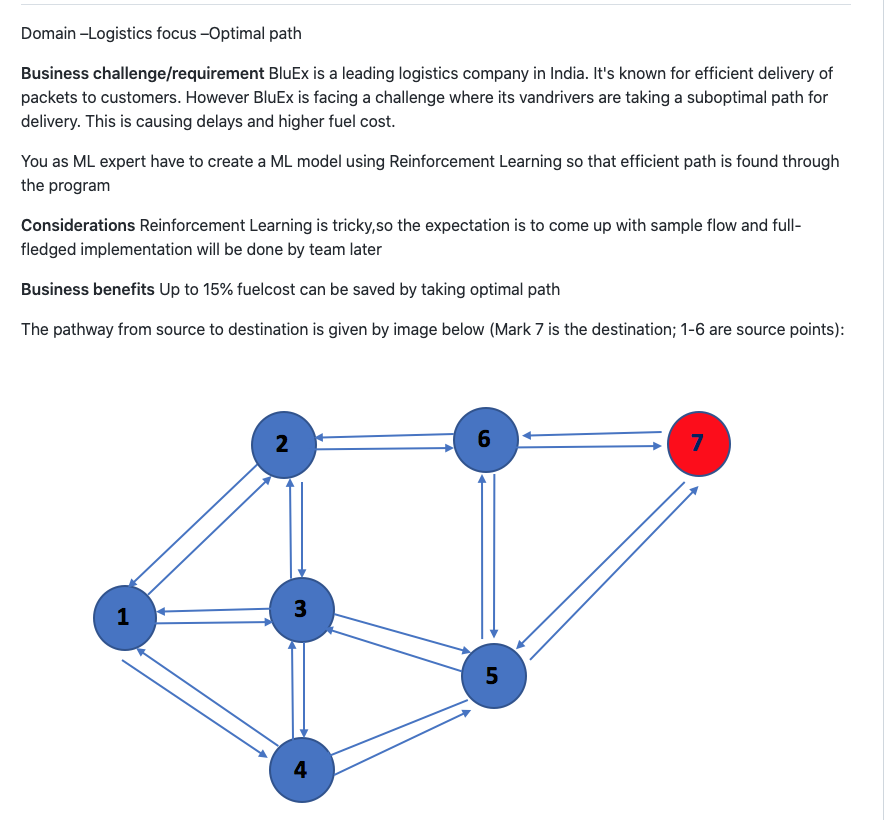
Project 1: Reinforcement Learning

Project 2: Unsupervised Image Seqmentation
Objective:
Use k-means clustering for image segmentation and to identify dominant color in the image.
Question:
Display the image “dog.jpeg”. Convert the image in to numpy array, so that it can be used in further processing
Find out the dimensions of the image and convert it in to a two-dimensional array
Use kmeans clustering with k set to 5 and cluster the image
Predict the cluster label of every pixel in the image and plot it back as an image
Find out the five dominant color in the image
Project 3: Time Series Analysis
Domain – SEA Transportation focus – forecast demand Business challenge/requirement
SeaPort is the largest operator of Sea Planes across sea shores in Europe.
SeaPort doesn't have planes of their own, rather they lease themon a short-term basis based on passenger traffic. You as an ML expert have to builda model to forecast the demand (passenger traffic) of traffic.
Key issues
As of now utilization of Planes is low due to poor forecasts of traffic
Considerations
NONE
Data volume
Approx 144 records–data month wise for last 12 years – file SeaPlaneTravel.csv
Fields in Data
Month: Month in which traffic data was recorded
'#Passenger': No of travellers availing Service in that month
Additional information
-NA
Business benefits
Better utilization of planes will lead to decrease in cost and hence better bottom line
Project 4: Association Rule Mining
Market Basket Analysis There is an online transactional data of a retail store containing the information of different items sold in different countries
Key Issue As of now the company doesn't have a robust rule to club the items to maximize its sell Goal. You as an ML expert have to build a model to develop association rules, using online transaction data of retail store, with their corresponding support, confidence and lift values
Strategy Deploy apriori algorithm
Project 5: Breast Cancer Prediction
Features are computed from a digitized image of a fine needle aspirate (FNA) of a breast mass.
Attribute Information:
1) ID number
2) Diagnosis (M = malignant, B = benign)
3-32) Ten real-valued features are computed for each cell nucleus:
a) radius (mean of distances from center to points on the perimeter) b) texture (standard deviation of gray-scale values) c) perimeter d) area e) smoothness (local variation in radius lengths) f) compactness (perimeter^2 / area - 1.0) g) concavity (severity of concave portions of the contour) h) concave points (number of concave portions of the contour) i) symmetry j) fractal dimension ("coastline approximation" - 1)
The mean, standard error and "worst" or largest (mean of the three largest values) of these features were computed for each image, resulting in 30 features. For instance, field 3 is Mean Radius, field 13 is Radius SE, field 23 is Worst Radius.
All feature values are recoded with four significant digits
Missing attribute values: none
Class distribution: 357 benign, 212 malignant.
